Chandigarh Air Quality Index & Realtime Air Pollution
Current Conditions
Humidity: 55%
Primary Air Pollutants Chandigarh
| Pollutant | Concentration | Details |
|---|---|---|
| PM2.5 | 64 µg/m³ | Fine particles |
| PM10 | 136 µg/m³ | Coarse particles |
| SO₂ | 15 µg/m³ | Sulphur dioxide |
| CO | 346 µg/m³ | Carbon monoxide |
| NO₂ | 3 µg/m³ | Nitrogen dioxide |
| O₃ | 184 µg/m³ | Ozone |
Hourly forecast Chandigarh
| Time | Temp | Condition |
|---|---|---|
| Now | 34°C |  Mostly clear Mostly clear |
| 16:00 | 33°C | Mostly clear |
| 17:00 | 33°C | Mostly clear |
| 18:00 | 32°C |  Clear sky Clear sky |
| 19:00 | 30°C |  Clear sky Clear sky |
| 20:00 | 29°C | Clear sky |
| 21:00 | 29°C | Clear sky |
| 22:00 | 28°C | Clear sky |
| 23:00 | 28°C | Clear sky |
| 00:00 | 27°C | Clear sky |
| 01:00 | 27°C | Clear sky |
| 02:00 | 26°C | Clear sky |
| 03:00 | 26°C | Clear sky |
| 04:00 | 26°C | Clear sky |
| 05:00 | 26°C | Clear sky |
| 06:00 | 27°C | Clear sky |
| 07:00 | 29°C | Clear sky |
| 08:00 | 30°C | Clear sky |
| 09:00 | 31°C | Clear sky |
| 10:00 | 32°C | Clear sky |
| 11:00 | 33°C | Clear sky |
| 12:00 | 34°C | Clear sky |
| 13:00 | 34°C | Clear sky |
| 14:00 | 34°C |  Light drizzle Light drizzle |
Health Recommendations
Based on current air quality: Unhealthy · AQI 172
- Air PurifierTurn On
- Car FilterMust
- N95 MaskMust
- Stay IndoorMust
Everyone may begin to experience health effects; members of sensitive groups may experience more serious health effects. Active children, adults, and people with respiratory diseases should avoid prolonged outdoor exertion.
2.9 per day
Equates to breathing local air
20.3 cigarettes
87 cigarettes
Prevent Health Problems
Risk is High for Unhealthy conditions (AQI 172).
Typical signs can include: Pressure or tightness around the forehead and temples, Sensitivity to light or smell, Fatigue or difficulty concentrating.
- Choose indoor, clean indoor air when the AQI is elevated.
- Stay hydrated and take short breaks from devices or harsh light if you are migraine-prone.
- If you Make use of prescribed migraine meds, Keep close them accessible.
- Try not to do intense outdoor exercise during worse AQI periods.
- Don’t ignore worsening symptoms that feel unusual for you.
Historical AQI Data Chandigarh
Air Quality FAQs at Chandigarh
Frequently Asked Questions
About Air Quality
The current real-time AQI (US) level in Chandigarh is 172 (Unhealthy). This was last updated recently.
The best AQI (US) level was generally lower during the early afternoon in the last 24 hours.
The worst AQI (US) level typically peaks during early morning or late evening hours due to temperature inversion.
The AQI (US) levels in Chandigarh have been fluctuating throughout the last 24 hours depending on traffic and weather conditions.
Current AQI (US) levels are unhealthy for everyone. It's advised to adjust your outdoor activities based on personal sensitivity.
Recent AQI Blogs
Read all blogsHere are some latest blogs that you can go through to find out more about air pollution, heatwaves, and local atmospheric insights.
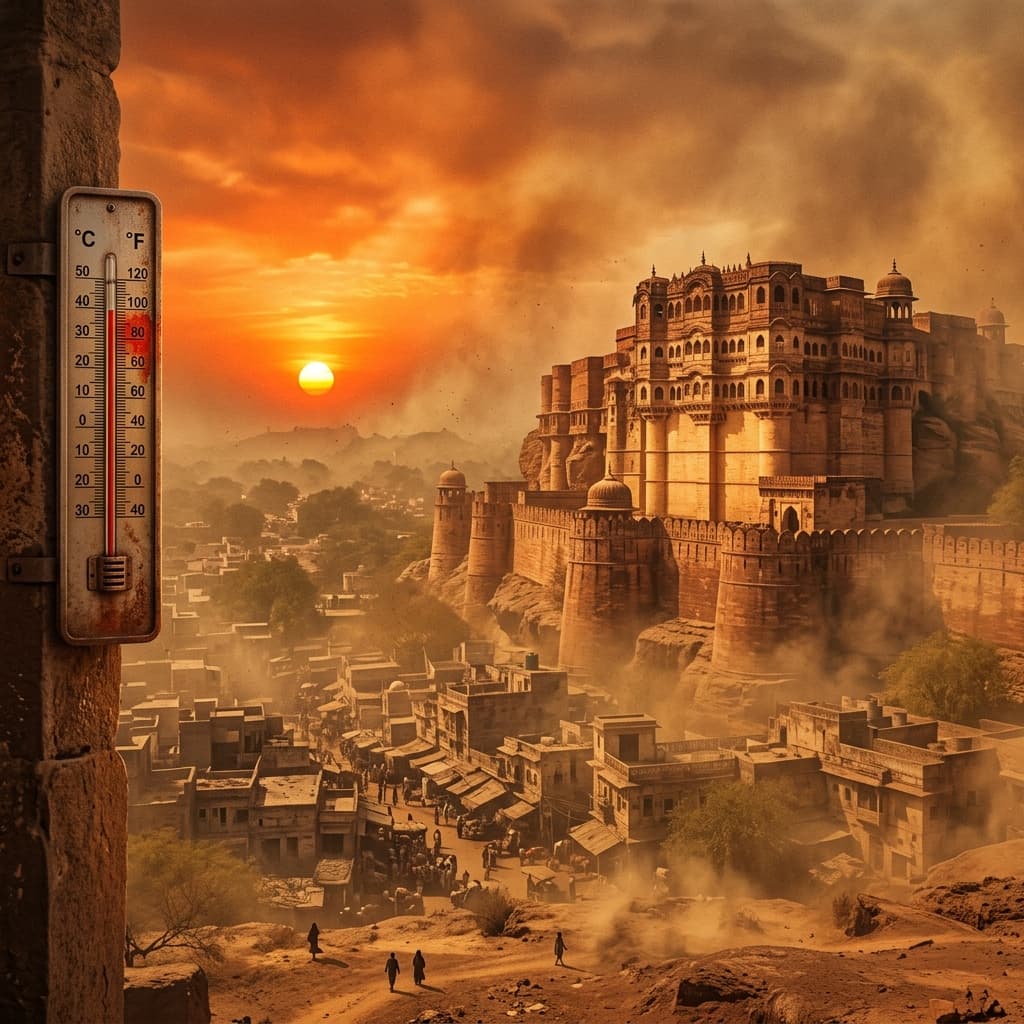
World Top 10 Hottest Cities Are All in India Again - May 2026
For the second consecutive month, Indian cities dominate the global heat charts. We analyze the meteorological drivers behind this unprecedented heatwave.
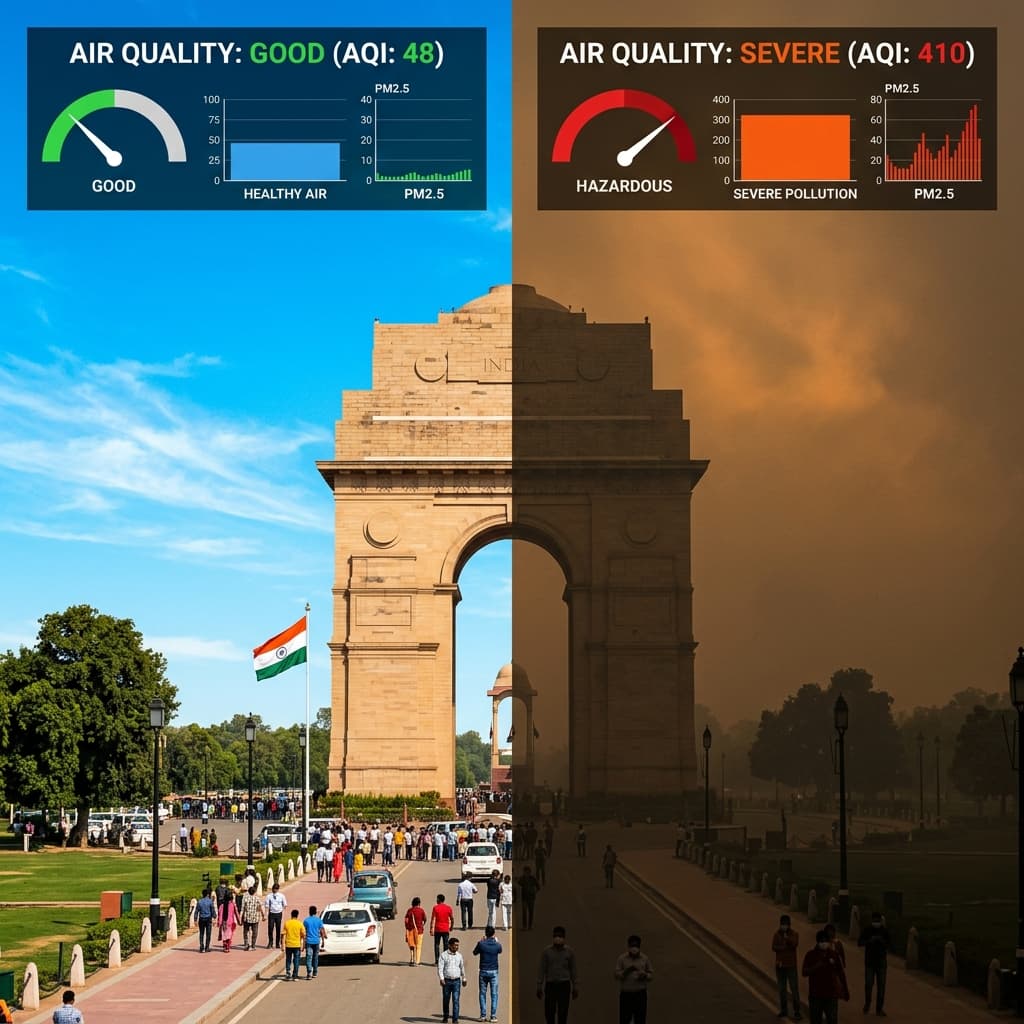
Delhi Air Quality 2026 vs 6-Year Historical PM2.5 Data
Statistical analysis comparing 2026 PM2.5 averages to historical data since 2020, highlighting trends and regulatory impacts.
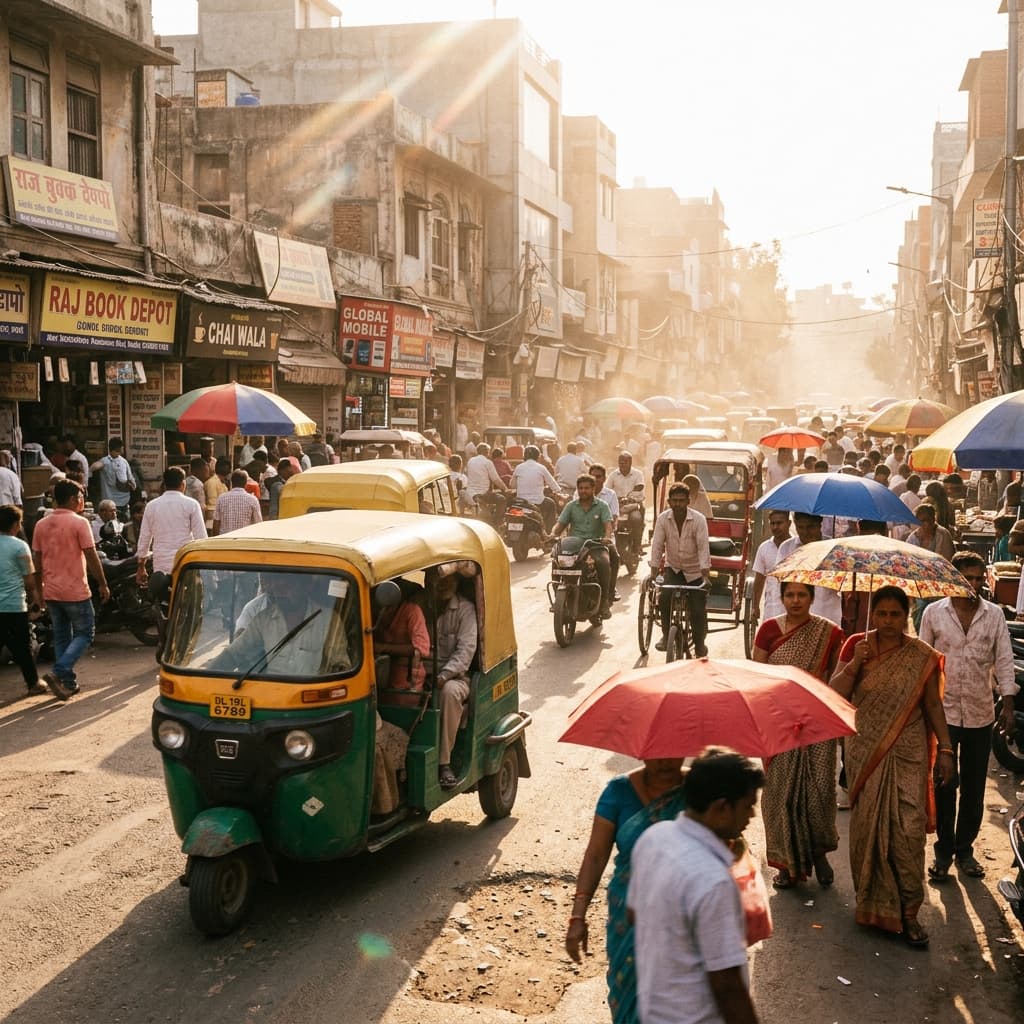
What 17 Years of Delhi Temperature Data Reveal About May's Heatwave Escalation
A deep dive into 17 years of meteorological recordings to trace the steady rise of summer temperatures and heatwave durations in Delhi NCR.